The cost of doing business 2022q2 Data from the Small Business Price Index
Small businesses with less than 50 employees employ 12.9m people (48 per cent of total private sector employment) and account for 36 per cent of private sector turnover. The Small Business Price Index (SBPI) provides an indication of the cost of doing business among this critical group of firms.
The SBPI suggests that small business costs increased more rapidly in 2022q2 than in any period since the start of the SBRI series in 2008 (Figure 1). Small business costs rose 4.4 per cent in 2022q2 alone, following a 4.3 per cent increase in 2022q1. Both represent a higher rate of small business cost inflation than at any period since 2008.
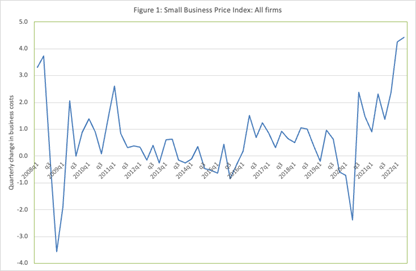
Source: ERC SBPI
The SBPI like other price indices such as the Consumer Price Index (or CPI) is based on a combination of data on the prices of individual expenditure items and detailed information on the spending consumption of small firms (see a list in Annex 1). In analysis we can differentiate between the cost profile of micro and small enterprises and different types of micro and small businesses.
Business costs for small (10-49 employees) and micro businesses (1-9 employees) have tended to rise and fall together over the period since 2008 (Figure 2). In recent quarters, however, cost rises have been greater for micro-businesses: micro-business costs rose 4.5 per cent in 2022q2 compared to 4.0 per cent for small firms. This difference is due to their different cost structure.
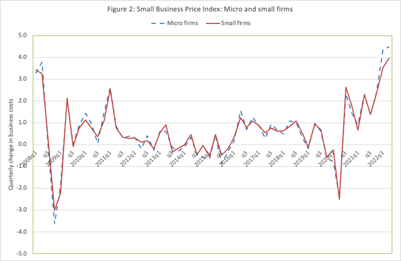
Source: ERC SBPI
The sharp increase in costs evident in late 2021 and through 2022q1 and 2022q2 for micro and small firms is equally evident in manufacturing and services sectors (Figure 3). For both groups of firms current cost increases are at, or above, the highest level since 2008.
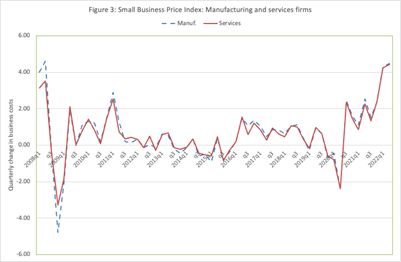
Source: ERC SBPI
Micro and small businesses are a diverse group, and in Figure 4 we report the SBPI for three significant sub-groups of firms – shops, home-based businesses and contractors who are likely to be mobile. There is a common general trend in cost changes over the 2008-2022 period (Figure 4). Shops and contractors are being hit particularly hard by current cost rises with cost increases of 5.1 per cent and 4.2 per cent over 2022q2 alone. Home-based businesses faced a marginally lower rate of cost inflation of 3.3 per cent over the same quarter.
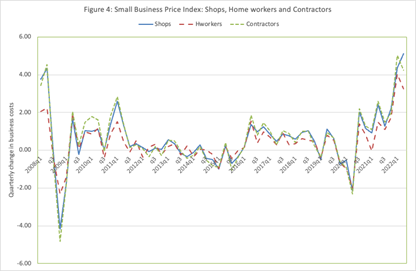
Source: ERC SBPI
The next update of the Small Business Price Index should be available in mid-November and will cover business costs during 2022q3.
Table 1: Small Business Price Index: 2022q2: Summary 2017-22
| 2017 | 2018 | 2019 | 2020 | 2021 | 2022q1 | 2022q2 | |
| Business Inflation Guide (% change per quarter) | 0.7 | 0.7 | 0.2 | 0.2 | 1.7 | 4.3 | 4.4 |
| Manufacturing (% change per quarter) | 0.8 | 0.8 | 0.1 | 0.3 | 1.9 | 4.3 | 4.5 |
| Services (% change per quarter) | 0.7 | 0.7 | 0.2 | 0.2 | 1.7 | 4.3 | 4.4 |
| Micro businesses (% change per quarter) | 0.7 | 0.7 | 0.2 | 0.2 | 1.7 | 4.4 | 4.5 |
| Small businesses (% change per quarter) | 0.7 | 0.8 | 0.2 | 0.4 | 1.7 | 3.5 | 4.0 |
| Shops (% change per quarter) | 0.7 | 0.8 | 0.1 | 0.1 | 1.7 | 4.4 | 5.1 |
| Home workers (% change per quarter) | 0.6 | 0.5 | 0.1 | -0.2 | 1.1 | 4.0 | 3.3 |
| Contractors (% change per quarter) | 0.8 | 0.7 | 0.2 | 0.1 | 1.8 | 5.0 | 4.2 |
Annex: The Small Business Price Index
The Small Business Price Index (SBPI) summarises information on twenty of the most important expenditure items for small businesses with less than 50 employees. Price changes for each item are taken from series published by the Office for National Statistics (see below). Expenditure weights are based on spending data from 500 small firms gathered during July and August 2008.
The expenditure items covered by the Business Inflation Guide are:
| 1 | Professional Services | 4 | Vehicle Costs (current) |
| 1.1 | Advertising services | 4.1 | Vehicle insurance and tax |
| 1.2 | Insurance | 4.2 | Vehicle repair and maintenance |
| 1.3 | Financial services | 4.3 | Fuel costs |
| 1.4 | Other services (accountancy, legal) | ||
| 5 | Staffing Costs | ||
| 2 | Telephone, Communications | 5.1 | Labour costs (including social security costs) |
| 2.1 | Business Telecomms | ||
| 2.2 | Post and delivery services | 6 | Materials and Services |
| 6.1 | Raw materials | ||
| 3 | Establishment Costs | 6.2 | Cost of services |
| 3.1 | Premises costs (rent/mortgage) | ||
| 3.2 | Premises costs – business rates | 7 | Capital Items |
| 3.3 | Gas used by the business | 7.1 | Office equipment furniture |
| 3.4 | Electricity used by the business | 7.2 | Production equipment/tools – purchase or leasing |
| 3.5 | Water and sewerage charges | 7.3 | Vehicle purchase or leasing |
A telephone survey was conducted during July and August 2008 to establish the most important expenditure items for small businesses. The sampling frame was obtained from Dun and Bradstreet and quotas were imposed on responses to ensure results were robust by firm size, industry, and region. Samples excluded agricultural businesses (Division 01/05) and those in mining and quarrying (Div 10/14). Interviews were conducted with the owner or another person in a position to provide the cost data required (e.g., accounts department). Final responses included data from 500 small businesses with responses being weighted to correct for response bias and quota sampling.
No specific price data exists for small businesses, so the Small Business Price Index relies on national price indices for specific items. The majority of price data is taken from publications by the Office of National Statistics (ONS) including: the Services Producer Price Index (SPPI), the Consumer Price Index (CPI) and the Producer Prices Index (PPI). Source information for each price index used is given in Table A1 below with individual index values in Table A2 and Figure A1.
Table A1: Price Indices – Sources
| Expenditure item | Series Identifier/Name | Provider | Publication | |
| 1 | Professional Services | |||
| 1.1 | Advertising services | SPPI HUFD Advertising and Market Research Services (Chained) | ONS | SPPI |
| 1.2 | Insurance | D7F2CPI INDEX 12.5.2: Insurance connected with the dwelling | ONS | CPI |
| 1.3 | Financial services | D7CZCPI INDEX 12.6.2: Financial services n.e.c. | ONS | CPI |
| 1.4 | Other services (accountancy, legal) | D7FRCPI INDEX 12.7: Other services nec | ONS | CPI |
| 2 | Post and delivery services | |||
| 2.1 | Business Telecomms | SPPI HR4K Telecommunications Services (chained) | ONS | SPPI |
| 2.2 | Post and delivery services | SPPI HQSR Postal and courier services (chained) | ONS | SPPI |
| 3 | Establishment Costs | |||
| 3.1 | Premises costs (rent/mortgage | SPPI HZI6 Rental and Leasing Services (Chained) | ONS | SPPI |
| 3.2 | Premises costs – rates (interpolated) | Non-domestic rate multiplier (annual) – interpolated quarterly | GLG | |
| 3.3 | Gas | D7DU CPI index Gas | ONS | CPI |
| 3.4 | Electricity | D7DT CPI index electricity | ONS | CPI |
| 3.5 | Water and sewerage charges | SPPI HOZE Sewerage services | ONS | SPPI |
| 4 | Vehicle Costs (current) | |||
| 4.1 | Vehicle insurance and tax | D7F3CPI INDEX 12.5.4: Insurance connected with transport | ONS | CPI |
| 4.2 | Vehicle repair and maintenance | SPPI HPTD Maintenance of motor vehicles (Chained) | ONS | SPPI |
| 4.3 | Fuel costs | Weekly energy prices: Pump price of diesel at end of quarter | BEIS | Energy Prices |
| 5 | Staffing Costs | |||
| 5.1 | Labour costs | KAC4 AWE Total Pay for private sector | ONS | AWE |
| 6 | Materials and Services | |||
| 6.1 | Raw materials | GHIK – Materials Purchased by Manufacturing Industry Excl. CCL (chained) | ONS | PPI |
| 6.2 | Cost of services | SPPI HQTI Top level. Indicator | ONS | SPPI |
| 7 | Capital Items | |||
| 7.1 | Office equipment furniture | MM17 JV5A Computers and peripheral equipment | ONS | MM17 |
| 7.2 | Production equipment/tools – purchase or leasing | MM17 JV4B Tools | ONS | MM17 |
| 7.3 | Vehicle purchase or leasing | D7COCPI INDEX 07.1: Purchase of vehicles | ONS | CPI |
Table A2: Price Indices Summary Values
(percentage change per quarter)
| 2017 | 2018 | 2019 | 2020 | 2021 | 2022q1 | 2022q2 | ||
| 1 | Professional Services | |||||||
| 1.1 | Advertising services (% change per quarter) | 0.52 | -0.21 | 0.54 | 0.17 | -0.20 | 9.30 | 0.26 |
| 1.2 | Insurance (% change per quarter) | 1.04 | 0.83 | 0.35 | -0.55 | -0.63 | 18.45 | 2.34 |
| 1.3 | Financial services (% change per quarter) | -0.63 | -1.24 | 0.32 | -1.21 | -0.39 | 0.57 | -0.11 |
| 1.4 | Other services (% change per quarter) | -0.85 | 0.16 | 0.61 | 0.47 | -0.32 | -2.29 | 0.20 |
| 2 | Telephone, Communications | |||||||
| 2.1 | Business Telecomms (% change per quarter) | -0.30 | 0.41 | -2.11 | -4.11 | -1.51 | 0.00 | 0.00 |
| 2.2 | Post and delivery services (% change per quarter) | 0.22 | 0.25 | 0.19 | 0.63 | 0.26 | 2.06 | 2.47 |
| 3 | Establishment Costs | |||||||
| 3.1 | Premises costs (rent/mortgage) (% change per quarter) | -0.55 | 0.38 | -0.08 | 0.25 | 0.20 | 1.30 | 1.38 |
| 3.2 | Premises costs – rates (% change per quarter) | -0.10 | 0.64 | 0.47 | 0.20 | 0.00 | 0.00 | 0.00 |
| 3.3 | Gas (% change per quarter) | 0.00 | 1.86 | -1.97 | -3.95 | 6.62 | 0.10 | 66.73 |
| 3.4 | Electricity (% change per quarter) | 2.76 | 2.21 | 0.99 | -0.80 | 4.50 | 0.35 | 40.62 |
| 3.5 | Water and sewerage charges (% change per quarter) | 0.15 | -0.07 | -0.25 | 0.00 | -0.20 | 0.31 | 3.76 |
| 4 | Vehicle Costs (current) | |||||||
| 4.1 | Vehicle insurance and tax (% change per quarter) | 2.46 | -2.67 | 1.45 | -1.46 | -1.02 | 4.40 | 3.25 |
| 4.2 | Vehicle repair and maintenance (% change per quarter) | 0.82 | 0.86 | 0.45 | 0.58 | 0.57 | 2.49 | 1.00 |
| 4.3 | Fuel costs (% change per quarter) | 0.96 | 1.42 | 0.06 | -2.03 | 5.63 | 18.56 | 12.75 |
| 5 | Staffing Costs | |||||||
| 5.1 | Labour costs (% change per quarter) | 0.65 | 0.92 | 0.61 | 1.19 | 1.22 | 2.53 | 0.33 |
| 6 | Materials and Services | |||||||
| 6.1 | Raw materials (% change per quarter) | 1.16 | 1.00 | -0.30 | -0.06 | 3.27 | 5.11 | 8.92 |
| 6.2 | Cost of services (% change per quarter) | 0.51 | 0.36 | 0.38 | 0.16 | 0.89 | 1.43 | 1.76 |
| 7 | Capital Items | |||||||
| 7.1 | Office equipment furniture (% change per quarter) | 1.27 | -0.11 | -0.42 | 0.02 | -0.49 | 0.27 | 0.82 |
| 7.2 | Production equipment/tools (% change per quarter) | 1.10 | -0.05 | 0.03 | 0.08 | -0.72 | 0.53 | 0.21 |
| 7.3 | Vehicle purchase or leasing (% change per quarter) | 0.63 | 0.86 | 0.05 | 1.38 | 3.13 | 1.20 | -1.35 |
Stephen Roper, Director, ERC
Please note that the views expressed in this blog belong to the individual blogger and do not represent the official view of the
Enterprise Research Centre, its Funders or Advisory Group